Thursday, October 25, 2012

How Moving average Helps to wave counting of elliott wave

look 1hr chart.
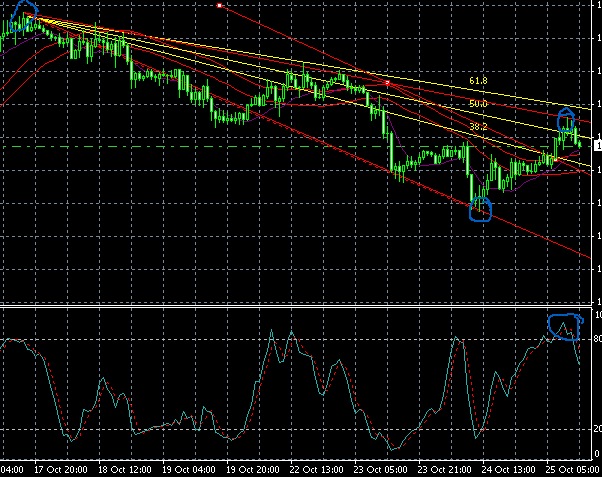
EW analysis of USD/CHF 1 hr chart


I have used 6 MA
12
21
34
55
87
100

MACD indicator

MA 55 acts as support for extreme of wave 1 and start of wave 2
MA 100 acts as resistance for wave 4, so we can put sell entry with sl 15 pips above it.


When trend is ending

when MA 12 is touching 21, crossing and crossing 34, crossing 55, trend is ending
Also MACD helps to count 3rd , 5th wave

EW analysis , How Head and shoulder formed.1 hr chart


Note 

  • wave 1 is as break out of previous support and resistance, 
  • wave 1 extreme and wave 2 start can be assumed by MA 55

  • We need to wait till wave two ends for channeling and trend line drawn
  • As to draw trend line at least two hh or HL, LL, LH needed.

  • We also need to wait for at least two  hh or HL, LL, LH to see break out.

  • After breakout price retest the the break out point.

Rule of alteration of corrective wave:

If wave 2 retrace 61.8% wave 4 will retrace 38% of wave 3, which is equvallent of 61.8% of wave 1, if wave 2 retrace 38% of wave 1, wave 4 will retrace 61.8%.

If wave 2 form simple corrective wave , wave 4 will form complex corrective wave and vice versa.


Day trading with trend ine and Elliott wave

look at the picture.


  • 1hr trend is down, new corrective wave is end.
  • 1-5 wave formation with corrective wave formation occured.

  • price is respecting 84% fibbonacci fan and reversing, So here is resistance.

  • So price will go down.

price is trying to break the dynamic resistnce, Stochastic show ovebought and
price fails to do soand price returns back to down trend direction.
Fibbos fan 84% is strong resistance with outer trend line.Also look at
candlestick formation double tops formation occured with large wicks, so price will retrace back.

now elliottwave analysis of 1 hr chart

elliott wave completed with corrective wave formation, corrective wave also forms 12345,
note, Important head and shoulder formation occured, So we will trade in down trend
direction with protactive SL

Day trading with trendline and Elliotwave

It is 4 hrs chart.
I have noticed price is respecting outer trend line, the fibbos fan the 61.8% is .9480
it is the strong resistance, So price will go down
look at the picture


Also look for EW nalysis, In 4hrs chart wave 5 completed and now on abc correction so the price will correct to 61.8% at .9480 or 78% .

as wave five completed we need to wait for new impulsive wave formation.

Now it is on correction.

Also look lt shoulder and head formation occured, so we need to wait for rt shoulder formation and breaking
at neck line.

Note,

Corrective wave always in channel.
Price also respect fibbos as support and resistance.


Forex Mastering course

Forex is online foreign currency exchange , It is heavy risky, Everybody do not suit forex trading.

It takes 12-24 months to become trader and take years becoming expert. Knowledge is power and when it is added with technique it becomes super power.


One to one training
duration 6 months, mon-wed
live account trading
Hands on trading training


After training, here U will learn
  • when to enter market, when to out
  • When to invest, How much.
  • Risk reward ratio
  • market cycle
  • Trend and trend identification
  • trend reversal
  • how to identify trend begening,ending of trend
  • how to trade on news
  • Daily trade and intermediate and long term trade
  • Causes of loss, how to reduce loss.
  • How to forecast
  • Details of indicator we usually use , how to use
  • trend, trendline, trend channel , how to trade
  • Candle sticks and how to trade on
  • fibbos, BB,MACD,RSI ,MA , proper use of these indicators,
  • EW, how to identify, how to start trading with EW.
  • trading style, trend ridding, trend following
  • How to set TP, SL. How to set orders.
  • Useful trading strategy

venue: Dhaka, details will inform latter

Interested please contact.
Email: nizammozumder@gmail.com

Trading trendline break out and fake out

Trend line:

It is  line drawn from at least two higher high or lower low.
But three will be best 
Can be drawn high to low also.
It acts as dynamic line of support and resistance for trading.
Price alsways respects this type of line.

Look at this picture , MACD momentum also small, with corresponding spinning tops formation, So price will go down  finally gone also.

look at the picture below


look at the picture price is touching 200 MA and reversing
at that moment RSi is overbought. So price will go down.


look at the picture, Here trend is drawn and it is down, I added Fibbos fan
price is touching 50% and retraching back to down, As all prices are withinon
channel so it may be corrective wave in larger time frame.
Stochastic is also oversold, so the price will retrace and go down.

Look at the candle stick formation, spinning tops with large wick so price will retrace.
Also look for BB as it indicates volatility of market,
Here Spinning tops formation occured at BB upper band
So it is the sign of reversal, price just touched 1.3030 and gone back down.

Look at the picture below trend line is drawn and trend is down.
the future price will follow trend line and go down.
Also look at RSI is overbought. I have drawn the trend line
and expect future price will be 1.3030 and then will go down.
So by using these Indicators we can differentiate breakout from fake out or false break out.
Indicators  used here
  • BB
  • Fibbos fan
  • Trend line( HH,LL)
  • Stochastic( oversold/overbought0
  • RSI(oversold/Overbought)
  • MACD
Steps to avoid fake out.
Step 1 , draw trend line
Step 2 See Stochastic/RSI oversold/overbought position
Step 3 MACD to see small or large momentum
Finally Add BB to see sign of reversal

Its all practice which make you a better trader.
Always use SL

Trend line trading how to avoid fake out

Look at the picture below


How moving average can help to count elliot wave

Moving average :

it is lagging indicator.
Various types of moving average are used for detection of trend.


Look at the picture


  • As we know price above the moving average the trend is up
  • and price below the moving average the trend is down.

  • Look at the picture I have plotted various moving average,8,12,55,100,200 MA

  • price is respecting MA and price is above MA, so the trend is up.
  • But look minutely MA are compressed and then clearly seperated due to flactuation of price

  • Also look at the MACD , MACD also above zero line

  • The main matter is Here MA are works as Support and resistance level and finally price is retested on 200 MA which is the end of wave 4.

  • Wave 1 is formed where crossover and clear seperation occurs

  • Look I have used 6 different MA, Compression is the begening of EW and clear seperation and steepy angulation is the wave 3, In wave 2 retracement the price didi not crossed last two MA and at the tip of third wave the wave are away from each other.

  • Finally retested on 100, 200 MA, but never cross 200 MA, If price cross the 200 MA the trend will be changed.
 When MA do not gives real signal:
 ANS: IN NON TRENDING OR RANGING MARKET.

How Moving average can help to identify Elliott wave count

moving average are lagging indicator.
It can be used for identifying Elliott wave count.
But trend line and channelling technique are better and can identify wave more rapidly.

Elliottwave trading ,How channelling can identify web count

Look at the chart below

  • Its 4hrs chart above
  • see wave 1 started from 1.5450 Ended 1.5670
  • wave2 started from 1.5670 and ended on 1.5473
  • So I have drawn trendline connecting start of wave 1 and end of wave 2. It is the trend line of this chart of EUR/USD. Its up so the trend is up.
  • next draw a new line parallel to previous line from the end of wave1 , a channel made which is called base channel
  • third wave will end in the upper margin of this channel or may extend too far from this channel.
  • Look at the picture wave 3 form new high.
  • Now connect tip of wave 3 and extreme of wave 1, draw a parallel line to this , it makes ascending channel, it contains wave three.
  • wave 4 will end on the lower parallel line of this channel.
  • See tip of wave 3 and correction wave 4 a form new channel which is descending channel.
  • this descending channel will end up breaking upper line, which will make new wave five.
  • So now we are waiting for wave five impulsive wave, which is up, so the trend will be up after correction.
  • Wave 4 may touch line drawing from wave 1 and wave 2


Here some note


  • Corrective wave form various pattern, ABCD, ABC, triangle, diagonal , flat, zigzag,irregular
  • It takes more time than impulsive wave and choppy.
  • MA here are consolidate.


Trend line trading

look at the picture below


It is 1h chart 

here trend line drawn 
It is down trend.
But the price is going on

we have drawn another trendline on the high of previous trend line.
This line is also broken.

is the trend up????

Wait jut few moment ,,, 
we have drawn fibbonacci angle. the price is respecting fibbos angle and Bullish candle formation occured .

Ohh.. It is down trend on correction/retracement. Stochastic is also overbought. So put sell order with STop loss.

So trend channel can also be faked out..

In short For trend line trading

  • Draw trend line
  • Draw another line parralel
  • draw the fibbos angle
  • Add stochastic to see oversold/overbought 
  • also see candle formation


High probability use of Moving average

moving average is useful tool is forex, index, future

Thursday, October 18, 2012

Day trading with trendline strategy


13.How can we measure the strength of breakout:
We can use the following indicators to measure the strength of breakout
  • MACD
  • RSI

Moving Average Convergence/Divergence (MACD)
MACD is lagging indicator. We use this indicator for  seeing  buy and sell signal and strength of trend.

 Signal line crossover
  • Buy when MACD line crosses the Signal line from below to above.
  • Sell when MACD line crosses signal line from above to below.

Histogram:
  • Histogram above MACD zero line buy
  • Histogram below zero line  Sell

It’s height also show the strength of trend. Increase height of historogram increase trend strength. If it is above zero than it is uptrend strength is increasing. If height  increase below zero than it is increasing strength of down trend.

Divergence of MACD.
It shows signal before before change, Divergence is leading indicator.
Types of divergence:
  • Positive
  • Negative
  • Hidden divergence

Newer use:
  • Zero line reversal
  • Sling short
  • Hook
  • Head and shoulder, Inverse head and shoulder.
  • Double tops and bottoms


Relative Strength Index (RSI)
RSI is another momentum indicator that is useful for confirming reversal breakouts. I have written appropriate Uses of RSI in another  eBook.


Uses of RSI:
  • Double tops and bottoms
  • Head and shoulder and inverse head and shoulder
  • Oversold and overbought
  • Trend direction and strength of trend.
  • Divergence
  • Trend channel


Finally we need to see forex news in forex factory or economic events

14.False Breakouts/Fake out:

In any break out we need to determine the time frame that is 1 hrs is better for day trading, Than we need to determine support and resistance of that time frame. Some times price breakout occur and  it does not continue in new trend . As a result price will produce short spike. That is price breaks the Support and resistance and continue the previous direction.It is called false breakout
Or fake out.

15.How to avoid false breakouts or fake outs: How to trade on fake out
·         At first we need to wait after breakout to form at least two higher high or lower lows.if price does not form two lower low or two higher high we should think it is fake out.
·         Secondly We can use trend line , In false break out there is gap between price breakout and trend line
·         Thirdly , We can see the speed of breakout,In false breakout it is speed of price movement is much than it fall.
·         Fourthly we see the Chart pattern: in Head and shoulder , inverse head and shoulder, double tops and bottoms….. these are the pattern where false breakout occurs.
·         That is we can avoid fake out by using trend line, Chart pattern, Triangles, head and shoulder, Inverse head and shoulder

Trend line breakout


Head and shoulder pattern
T
Trend line breakout
Channel and channel breakout:

Channel breakout:


16.How to Trade Fakeouts

Use of trend line: In fake out /false breakout  there is gap between trend line and breakout prices
Speed of breakout: In False breakout the speed of price movement is much than normal  breakout.


FinallY: false breakout occurs in head and shoulder pattern, inverse head and shoulder pattern, double tops and bottoms, In these case one should wait till price crossing neckline then take the decision

Besides triangle for

Thursday, October 11, 2012

Day trading , Trend line strategy


Trend channel:
                Draw  primary trend line and draw secondary trend line parallel to primary line make a trend channel


Trend line break:
Usually price respect trend line and it repels trend line every time and touch and repels but certain situation where trend line breaks occur. specially Economic events or news release, NFP , other  special news events . News acts as trigger for breaking trend line. At that time price breaks trend line and new trend start in respect of that time.


 Types of break out:
·         Continuation break out
·         Reversal break out

Continuation Breakouts
Sometime price moves in a range and breaks the range in upper limit or lower limit and goes the previous same direction , it is called continuation  breakouts. So trend down--à consolidation-àcontinue the previous down trend
If U want to trade in this situation you need to wait till breaking the support and also you need to see the trend strength and weekness to guess the future price movement.


Reversal Breakouts
Reversal breakouts start off the same way as continuation breakouts in the fact that after a long trend, there tends to be a pause or consolidation.

The only difference is that after this consolidation, traders decide that the trend is exhausted and push the price in the opposite or "reverse" direction. As a result, you have what is called a "reversal breakout". You catch on quick!
How to spot breakouts:
At first We need to differentiate the breakout from fake out. Usually market breaks out occurs in high volatility condition so we can measure the volatility , secondly we can see the strength of breakout.
How to measure the volatility:
We can use the following indicators for measuring volatility
  • MA
  • BB
  • ATR
BB: When there is less volatility the BB constricts and when volatility increases the BB enpands. Its expansion indicates much volatile market 


ATR:
Increase Atr value indicate increase market volatility, decrease ATR value indicate decrease volatility.


How can we measure the strength of breakout:
We can use the following indicators to measure the strength of breakout
  • MACD
  • RSI

Trend line trading


Forex trading
TRENDLINE Break out
Fake out

Contents:

How  Forex market moves
What is trend
What is trend line
Characters of trend line
How to draw trend line
Trend line break
Types of trend line break
What is true break out and what is fake out/False breakout
How to identify breakout from fake out
How to measure breakout strength


How forex market moves?

Forex market moves continuously , it is due to imbalance between supply and demand, When more pressure on demand price increases and when more supply than demand price decrease. The upward movement is uptrend and downward movement is down trend. Market takes a pause before next movement it is termed as consolidation phase.
So market moves uptrend à consolidation-à uptrend -àconsolidation--àUptrend--àReverse trend-à downtrend--à consolidation-à downtrend continue----à reverse trend---à up
 Fig:

market structure
What Is trend?


·         It is the direction to which market moves.
·         It always follows nontrend  to trend to nontrend
·         That is trend….>nontrend/consolidation……..>>>trend……..>>>>nontrend.
·         Smallest time frame largest movement of market.
·         Trend starts from non trend/consolidation
·         Trend ends on nontrend
·         Trend are drawn higher high to higher low,  lower high to lower low not high to low/low to high.
·         Upward and downward sloping can define trend
·         Thre more time price touch trend line more strong trend

Types of Trends
There are three types of trends:
  • Uptrend (higher lows)
  • Downtrend (lower highs)
  • Sideways trends (ranging)


What is trend line;

It is the line drawn by Two swing high or swing low or two tops or two bottoms.
It shows the price direction of the market, that is market is going up or down that is up trend or down trend.
See figure


Types of trend line:

·         Internal trend line/Short  term trend line/interior trend line
·         Exterior/External trendline/Intermediate term trend line
·         Long term trend line

See figure
        
How do you draw trend lines?
To draw trend lines properly, all you have to do is locate two major tops or bottoms and connect them.
Here are trend lines in action! Look at those waves!

trendline 


Characters of  trend lines:
  • It takes at least two tops or bottoms to draw a valid trend line but it takes THREE to confirm a trend line.
  • The STEEPER the trend line you draw, the less reliable it is going to be and the more likely it will break.
  • Like horizontal support and resistance levels, trend lines become stronger the more times they are tested.
  • And most importantly, DO NOT EVER draw trend lines by forcing them to fit the market. If they do not fit right, then that trend line isn't a valid one!

Figure:


Time frame:
1hr time frame trend line is appropriate for intraday trading, For day trader draw trend line on 1hrs chart. It is the main trend line
of the day. 1 hr time frame chart shows the price action of last 2 weeks. Here 15 min chart for trade and 5 min chart for better entry.

4hrs time frame for drawing trend line  is better for day trader. As 4hrs chart shows the price action of last one month. Here 1 hrs time frame chart is for trading and 15 min chart time frame for fine-tuned entry.

Trend strength:

·         It depends on steepness of MA, RSI, MACD
·         Acuteness of MA crossover and separation
·         Parallel of MA
·         Holding 38% retracement is good sign of trend.
·         If the retracement is 50-61 .8% trend become weakens.
·         When MA is flat trend strength is decreased
·         In 1 hr trend line look for support and resistance


 1.       Price analysis
It is done by analyzing candlestick pattern
Bullish
Bearish
Reversal candlesticks


Trend channel:
                Draw  primary trend line and draw secondary trend line parallel to primary line make a trend channel