Friday, April 26, 2013
Thursday, April 25, 2013
Step by step guide for gann Trading.....Trading with gann Angle
There are a lot of of way in Gann Trading. I will describe all these step by step.
Today i will show how to trade on gann angle.
Time: x axis
Price : y axis
Gann Angle:
It is diagonal trend line drawn from to to bottom.
Uses :
Support and resistance
Today i will show how to trade on gann angle.
Time: x axis
Price : y axis
Gann Angle:
It is diagonal trend line drawn from to to bottom.
Uses :
Support and resistance
Wednesday, April 17, 2013
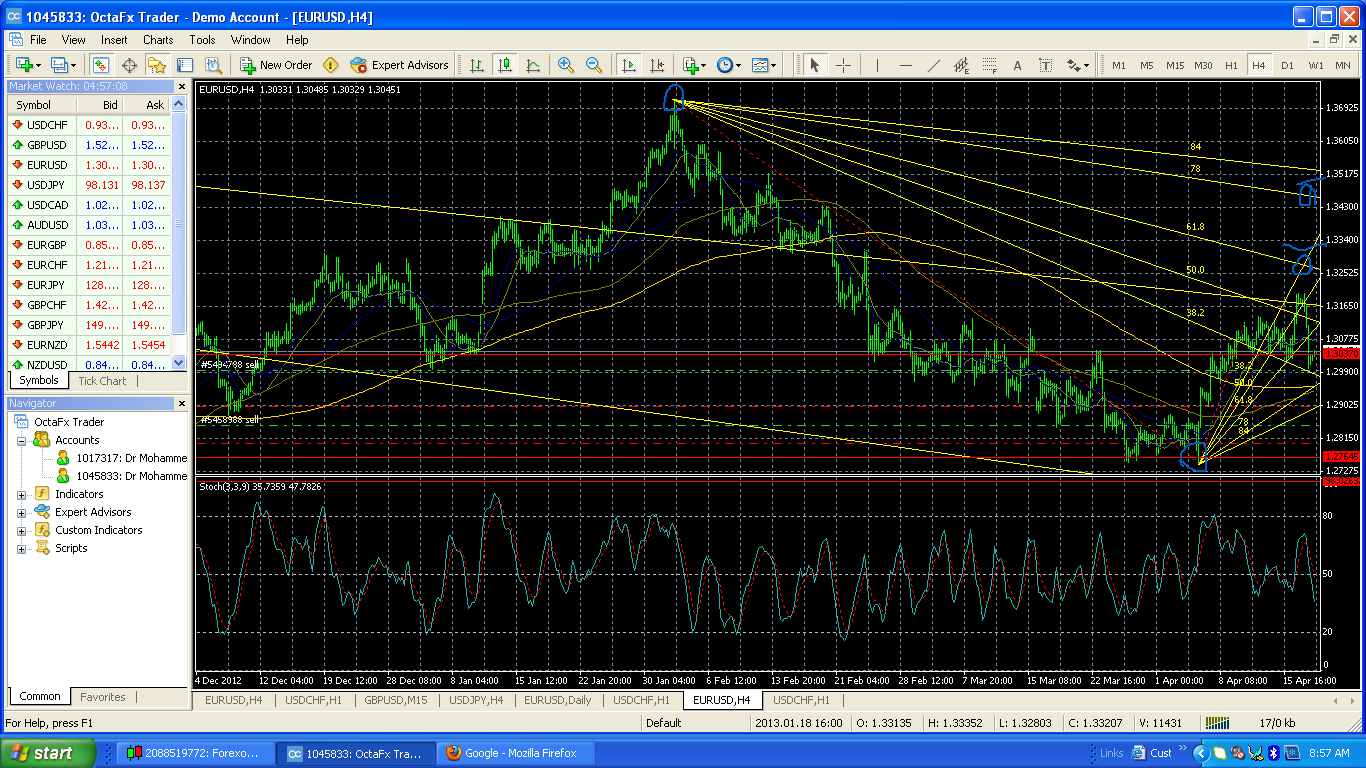
Use of Fibbos Fan in trend trading
Look at the picture
In 1 day chart there is down trend and draw fibbos fan high 1.4879 and low is 1.2230,
look at the chart fibbos fan at 78% retracement it is 1.3900( usually it retrace here), that is the trend will retrace upto that price and go down , but its highest retracement is 84% , if price goes beyond this limit the trend will change.

look 4hrs chart,
Here trend is down, high is 1.3695 and low is 1.2764, fibbos fan at 61.8% retracement is 1.3252 and 78% 1.3450,84% 1.3520, so price will retrace maximum 1.3520, if goes beyond that limit trend will change.
here we see price goes down at 61.8% retracement.
Most important in fibbos fan where two line cross is the maximum resistance or support.
In 1 day chart there is down trend and draw fibbos fan high 1.4879 and low is 1.2230,
look at the chart fibbos fan at 78% retracement it is 1.3900( usually it retrace here), that is the trend will retrace upto that price and go down , but its highest retracement is 84% , if price goes beyond this limit the trend will change.
look 4hrs chart,
Here trend is down, high is 1.3695 and low is 1.2764, fibbos fan at 61.8% retracement is 1.3252 and 78% 1.3450,84% 1.3520, so price will retrace maximum 1.3520, if goes beyond that limit trend will change.
here we see price goes down at 61.8% retracement.
Most important in fibbos fan where two line cross is the maximum resistance or support.
Day trading with Moving average


Look I have used 4 MA 21,55,100,200,
Here 200 MA is the ultimate resisitance or support line,if price cross the 200 MA trend will change.
See 200 MA is crossed by 21,55,100 from below to up, Price is above 200 MA, so trend is up
WE enter by with EUR/USD 1.3080, Candle must close above 200 MA,
other MA are used to see retracement.
Look price touched 1.3200 but my target is 1.3180
Why I have executed the trade here,
Here price is loosing the momentum look at MACD indicator, Stochastic indicator, when price loose its momentum ma comes closer.
look I have also used fibbos fan to see the support, as price is just touched MA 200, fibbos fan is 61.8% retraced so the trend will go up and it is the entry point,

Friday, April 5, 2013
Trend and Market theory, Elliot wave, Dow jones
First U must know,
What is trend
Definitive movement of currency to a certain direction, is called trend. It is Short time consuming , most of the movement occurs here. It is time dependent. So trend of certain time such as 1hr, 4hrs ,1 day, 30 min trend. but Higher time frame is less noise producing and professional trader use higher time frame.
Phase of trend:
Phase 1:
Accumulation:
It starts of breakout of previous S/R, Here people are in indecision on trading, It follows a correction which is wave 2, Correction , The correction follows fibbonacci retracement, It is correspond to wave 1 of EW..
Phase 2:
Participation:
After that traders feel interest in trading more trader comes it breaks previous resistance and make a stronger trends , It is most stronger trend , it corresponds to wave 3 of EW.It follows Fibbonacci extension.
phase 3:
Distribution:
After the phase 2 there is a Correction which is called wave 4, Here trader number decrease and few trader feel interest in trading, It corresponds wave 5. or phase of decline
this is the way market moves. It is applicable in any time frame even 15 min, 1 hr,4 hrs, daily. Every where in trading.
In dow jones theory accumulation, participation, distribution phase in any move.
My favorite time frame for trading
My favorite time frame for day trading


Less stress full Time frame for trading;
daily chart for trend detection
4hrly chart for viewing trade
1hr chart for entry
- 4Hrs chart for trend detection
- 1hrs chart for viewing and trading
- 15 min chart for Entry or exit.


Less stress full Time frame for trading;
- 1 day chart for trend detection
- 4 hrs chart for trading or viewing chart
- 1 hrs chart for Entry or Exit.
daily chart for trend detection
4hrly chart for viewing trade
1hr chart for entry
Price Action trading : Forex
How to trade on Price action:
Day trading on price action
See news of importance.... if any trade news , if not following steps for day trading.
firstly Look for Market structure.
look for major support and resistance in 1hr chart
market move between major support and resistance
If once support or resistance is broken ,market can move next, in that case look for strength of breakout/fade out.
Secondly trend analysis
Look for trend in 1 hr chart
look for strength(along the trend) and weakness(against trend) of trend
look for volatility
Third step price analysis for suitable entry
FAQ : Trend trading
FAQ: Trend trading:
Q:How much frame is required for trend trading?
A: three time frame required for trend trading
Frame 4 hrs chart for detection of trend, Frame 1hrs for viewing chart, Frame 15min for entry or exit
Q: 4hrs trend is down, 1 hrs chart trend is down,15 min chart trend is up what to do.?
A: the total trend is down, but min shows correction, So enter trade at the end of correction.
Q: Which time frame is correct for day trading
A: 1 hr chart
Q: What factor influence the daily trading mostly?
A: News, News,,News!!!
Q: How to identify trend?
A: We use some trend indicator, trend line, trend channel for trend detection. But trend is time dependend
Q: How can we measure the trend strength?
A: We can Use momentum indicator(MACD,RSI,ROC,Williams %R)
Projection and Depth of momentum
momentum indicator is used to see trend strength, not the trend.
Thursday, April 4, 2013
Day trading and trend trading:
Day trading and trend trading:

Types:
1.Trend trading
a)Trend riding
How can I ride the trend?
b)Trend fading
How to identify trend fade?
2.Break out trading
Types of trend
a) Short time trend
1hr chart for trend detection, 15 min chart for Entry or exit
b)Intermediate trend
4hrs chart for trend detection, 1hrs chart for entry or exit
c)long term trend
1day/wkly chart for trend detection and 1hrs chart for entry
How Market Moves:
Trend(30% time) -----> nontrend(70%time)----->trend----->nontrend
Time frame , Min,hr,daily applicable to all time frame.

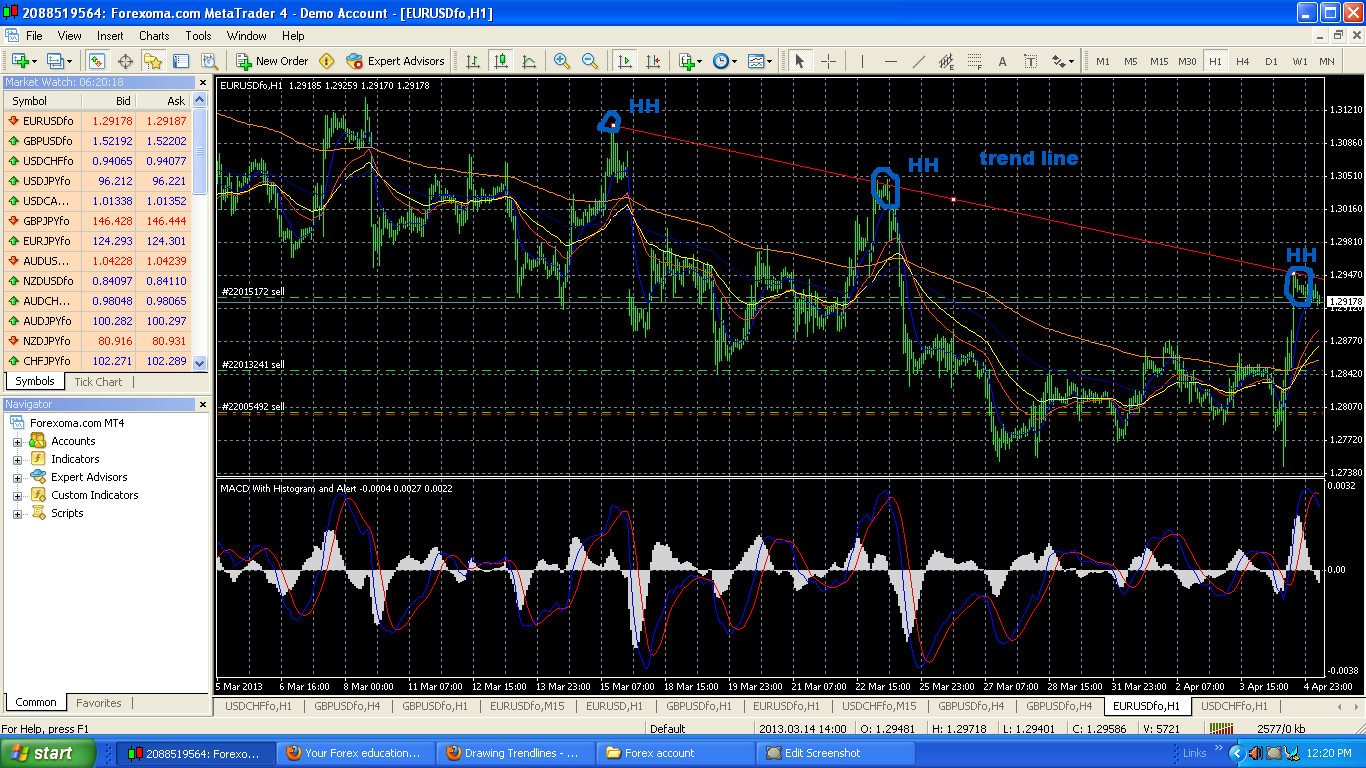
How to draw trend line:


Find resistance and support with that time frame
Find the Retracement:
Find Where the price retrace , Usually price retrace 33%-76%
Price retrace in the same time frame.
Why price retracement occurs: due to imbalance between support and resistance.
Types:
1.Trend trading
a)Trend riding
How can I ride the trend?
b)Trend fading
How to identify trend fade?
2.Break out trading
Types of trend
a) Short time trend
1hr chart for trend detection, 15 min chart for Entry or exit
b)Intermediate trend
4hrs chart for trend detection, 1hrs chart for entry or exit
c)long term trend
1day/wkly chart for trend detection and 1hrs chart for entry
How Market Moves:
Trend(30% time) -----> nontrend(70%time)----->trend----->nontrend
Time frame , Min,hr,daily applicable to all time frame.

How to draw trend line:


- draw line between two HH, or LL, three point will be good.
- Draw another parallel line with the primary line, It makes trend channel.
- See high and low of the channel.
Find resistance and support with that time frame
Find the Retracement:
Find Where the price retrace , Usually price retrace 33%-76%
Price retrace in the same time frame.
Why price retracement occurs: due to imbalance between support and resistance.
day trading main factor, NEWS
Most important factor influence on day trading, NEWS ,NEWS,,NEWS,,,
Wait for News ,
STOP trade.
START after NEWS.
GBP/USD - 156 PIPs
USD/CHF - 127 PIPs
USD/JPY - 102 PIPs
AUD/USD - 85 PIPs
NZD/USD - 81 PIPs
GBP/JPY - 172 PIPs
GBP/CHF - 161 PIPs
This is average daily range:
Wait for News ,
STOP trade.
START after NEWS.
Average daily range of movement of various pairs
EUR/USD - 111 PIPsGBP/USD - 156 PIPs
USD/CHF - 127 PIPs
USD/JPY - 102 PIPs
AUD/USD - 85 PIPs
NZD/USD - 81 PIPs
GBP/JPY - 172 PIPs
GBP/CHF - 161 PIPs
This is average daily range:
Day trading: Forex
buying and selling currency in the same day is called day trading.
Characteristics of Day trader:
Knowledge and experience
Sufficient capital
Strategy
Discipline
Types of day trading Strategy:
Scalping: Here profit target is small, Time frame for trend 1 hrs, Entry 15/5 mins
Fading: Entry at the to of trend
Momentum: Trading on news release
Daily Pivot:
Time frame:
4 hrs time frame for trend detection
1h
30 min for Entry or exit
Factors need for day trading:
Volatality and liquidity
Tuesday, April 2, 2013
Risk Reward ratio in Forex
In forex money management is most important part , U need to know how much risk you can take for what extent of reward.
usual R:R ratio
1: 1.5
example, Your TP is 60 pips and your SL is 40 pips, So your RR ratio is 1:1.5
Here you can profit even you win 50% of all trades.
Your total monthly trade is 20. You loose in 10, U profit in 10
So calculation is 10 loose trade= 10*40= 400, your profit trade 10, 10*60=600, So your total
gain is 600-400=200pips
preferred RR ratio
1:2
Example, your TP is 60 pips, SL is 30 pips, so RR ratio is 1:2
Here you can profit even you loose 60% of all trades.
Your total trades in month is 20, you loose in 12 trades and wiln in 8 trades
So the calculation is 12 loose trade= 12*30= 360, 8 profit trade is =8*60=480
Total gain = 480-360= 120 pips
But if you profit trade is 50%, so your profit will 600-300= 300 pips
My target:
I need to win 50% of all trades.
I stop the trading if win rate below 50,
Monday, April 1, 2013
Forex Money management: How much profit Can I earn per month
How much profit Can I earn per month
In forex trading monthly growth of 25% is enough. Suppose U have invested 1000 USD so your monthly target will be 25%, that is 250 USD, It is Hand some amount and U can obtain that success easily. So in that case your Weekly target will 65 USD and daily target will be 13 USD .
How much loss U can accept,
market will not move as with the directional way u always expect it may go against you, So U need to use stop loss to protect your capital.
daily loss of 2% is usually acceptable, If U loss more than 6% of total capital in a day stop the trade. It is for your capital protection.
How much pips in a day
usually EUR/USD daily trading range is 120 pips average, So you never make a target beyond this range, In daily trade your target profit is 60 pips and SL will be 40 pips, So your gain will be 20 pips for day trading.
If daily 20 pips , weekly 100 pips and monthly 400 pips this is enough for EUR/USD,
So in each pair u see daily trading range and make target less than the range.
How much capital U should invest:
Never invest >5% capital, If U have 1000 USD, U just invest 50 USD, levarage is 200,
Divide the capital into 4 equal parts invest 2 part and keep two part in hand.
Agressive trading :
Some trader wants daily 5% gain of total capital, It is risky but depends upon them.
Subscribe to:
Posts (Atom)