Trend
channel:
Draw primary trend line and draw secondary trend
line parallel to primary line make a trend channel
Trend line
break:
Usually price respect trend line and it repels trend line
every time and touch and repels but certain situation where trend line breaks
occur. specially Economic events or news release, NFP , other special news events . News acts as trigger
for breaking trend line. At that time price breaks trend line and new trend
start in respect of that time.
·
Continuation break out
·
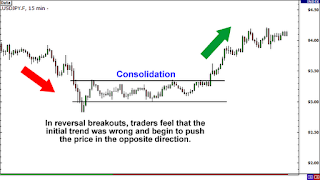
Reversal break out
Continuation Breakouts
Sometime price moves in a range and
breaks the range in upper limit or lower limit and goes the previous same
direction , it is called continuation
breakouts. So trend down--à consolidation-àcontinue the previous down trend
If U want to trade in this situation
you need to wait till breaking the support and also you need to see the trend
strength and weekness to guess the future price movement.
Reversal Breakouts
Reversal breakouts start off the same way as continuation
breakouts in the fact that after a long trend, there tends to be a pause or
consolidation.
The only difference is that after this consolidation,
traders decide that the trend is exhausted and push the price in the opposite
or "reverse" direction. As a result, you have what is called a
"reversal breakout". You catch on quick!
How to spot
breakouts:
At first We need to
differentiate the breakout from fake out. Usually market breaks out occurs in
high volatility condition so we can measure the volatility , secondly we can see the strength of
breakout.
How to
measure the volatility:
We can use the following indicators for measuring
volatility
- MA
- BB
- ATR
BB: When
there is less volatility the BB constricts and when volatility increases the BB
enpands. Its expansion indicates much volatile market
ATR:
Increase Atr
value indicate increase market volatility, decrease ATR value indicate decrease
volatility.
How can we
measure the strength of breakout:
We can use the following indicators to measure the
strength of breakout
- MACD
- RSI


This is really great reading. It’s full of useful information that’s easily understood and highly readable. I enjoy reading quality articles this well-written. Thank you. forex trading tools
ReplyDeleteFXB Trading has served as a beacon for many traders with its brokerage business. Merchants want to concentrate on speculation as they start trading in the CFD market. It is important not to lose track of the orders placed while speculating. Brokers are important when traders need help in speculation and analysis. FXB Trading has helped solve brokerage problems from many traders in the CFD market.
ReplyDeleteQuantum Binary Signals
ReplyDeleteProfessional trading signals sent to your cell phone every day.
Follow our signals NOW & make up to 270% per day.
Nice post. I was checking constantly this blog and I’m impressed! Extremely useful info specially the last part I care for such information a lot. I was seeking this certain info for a long time. Thank you and good luck.
ReplyDeletebest forex signals
thanks for sharing.
ReplyDeleteholi quotes 2018
happy holi sms 2018
holi sms 2018
happy holi images 2018
happy holi wishes 2018
holi wishes 2018