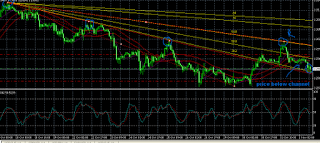
U must have to know:
- Daily chart shows data of 1-3 yrs this is long term trend
- 4hrs chart shows data of 6 months this is intermediate term trend
- 1hrs chart shows data of 1-3 months this is medium term trend
- 15 min chart shows data of 1-3 wks, this is short term trend
- Trend line will be retested after broken
What will happen when trend line is broken down:


No comments:
Post a Comment