Impulse Wave Price Targets
Price targets cannot only be set based on support and resistance lines, but also by using trend channels and Fibonacci projections. Remember that even the Elliott wave counts 5+3=8 are all Fibonacci numbers.
That is why all further wave subdivisions also are Fibonacci numbers.
That is why all further wave subdivisions also are Fibonacci numbers.
Price Target for Wave 1
 |
| wave 1 price target |
The most common, wave1, the start of a new impulse wave, retraces between 23.6% and 38.2% of the complete previous correction wave . Even 50% is possible but rare.
Price Target for Wave 2
 |
| wave 2 price target. |
Wave (2) retraces a minimum 38.2% of wave (1) ; however, most of the retracements are between 50% and 61.8%.
Even 100% retracement is possible and still complies with the Elliott rules.
Price Target for Wave 3

Price target for wave 3.
Looking at figure above once correction wave 2 is completed, you can draw an uptrend line from the start of wave 1 through the end of wave 2.
Next, you draw a parallel line with this trend line through the top of wave 1. Now you have a trend channel. The upper side of this channel is the first price target for wave 3.
If the price does not reach the upper side of this channel anymore, you probably are looking at a wave C, not a wave 3.
You should keep a horizontal support through the endpoint of wave 2. If the price falls through this level, wave 2 is not finished and will become more complex, and wave 3 has not yet started.
Impulse wave 3 often is the wave with the biggest move. So, usually, wave 3 will move up above the trend channel. In a rising impulse wave, it is common for the price to reach 161.8% of wave 1. In a falling impulse wave, wave 1 usually will reach 123.6%.
Price Target for Wave 4
 |
| wave 4 price target |
At the end of wave 3 in figure above, you can draw a trend line through the tops of waves 1 and 3. Now draw a parallel line through the bottom of wave 2. You now have a trend channel of which the lower side is the primary target for wave 4. Not reaching the lower side of this channel probably means that there is a strong trend and that you are still in wave 3, or there is only a short wave 5 to be expected.
Looking at Fibonacci levels, wave 4 usually retraces back to 23.6% and to 38.2% of wave 3. Most of the time, this will be in the price area of sub-wave 4 of impulse wave 3.
Price Target for Wave 5
Quite often you will see a wave 5 that is equal to wave 1, or 61.8% to 76.4% of wave 3. If there is a wave 5 extension, then wave 5 is commonly 161% of wave 3, or 161% of the sum of waves 1 and 3.
Looking at trend channels, there are two possible methods you can apply:
Looking at trend channels, there are two possible methods you can apply:
Method 1
Price target for wave 5, method 1.
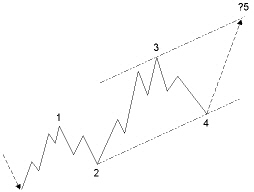
At the end of wave 4 in figure above, draw a trend line through the end of wave 2 and wave 4. Draw a parallel line through the top of wave 3. The upper side of this trend channel is the target for wave 5.
However, most of the time, this target will not be reached by wave 5, except when there are extensions in the making of wave 5, or when wave 3 was weak with just a moderate move.
Method 2
Usually, wave 3 has the highest acceleration compared to waves 1 and 5.
Usually, wave 3 has the highest acceleration compared to waves 1 and 5.

Price target for wave 5, method 2.
If wave 3 makes a bigger, sharp up-move like in figure 7.31, draw the basic trend line through the end of waves 2 and 4, but draw the parallel line through the top of wave 1.
This line will cross wave 3 and give a more moderate target for wave 5.
This line will cross wave 3 and give a more moderate target for wave 5.
Correction Waves Price Targets
Price Target for Wave A
Wave A in a zigzag correction will, most of the time, retrace 38.2% and 50% of the previous 5 wave.
Price Target for Wave B
Wave B in a zigzag correction mostly retraces 38.2% of wave A.
In a flat correction, this will be 100%.
A triangle correction will take back 90% to 100% of wave A.
An inverted widening triangle retraces commonly 61.8% of wave A.
In a flat correction, this will be 100%.
A triangle correction will take back 90% to 100% of wave A.
An inverted widening triangle retraces commonly 61.8% of wave A.
Price Target for Wave C
Wave C will, many times, equal wave A.
Wave C is a minimum 61.8% of wave A.
In a double zigzag, this is commonly 138.2% of wave W.
In a flat or double flat correction, this often is 138.2% of wave A, or wave Y, respectively.
Wave C in a triangle is generally 76.4% of wave B.
For an inverted widening triangle, this is commonly 123.6% of wave B.
Price Targets for Waves D and E

Price targets for waves D and E.
In figure above, at the end of wave B, draw a trend line through the beginning of wave A and the end of wave B.
You now can see a target for wave D, anticipating that a triangle correction is developing.
You now can see a target for wave D, anticipating that a triangle correction is developing.
You will get a confirmation at the end of wave C.
At the end of wave C, draw a line through the end of wave A and wave C. You now can see the target for wave E. Many times, wave E will not reach this trend line; conversely, it may pass it very shortly, next continuing the basic trend.
At the end of wave C, draw a line through the end of wave A and wave C. You now can see the target for wave E. Many times, wave E will not reach this trend line; conversely, it may pass it very shortly, next continuing the basic trend.
Price Target for Wave X
Wave X of a double zigzag, a double flat correction, or a triple zigzag is, most of the time, 50% of wave W. In a triple flat correction, this will be 76.4% of wave W.
Price Target for a Double Zigzag
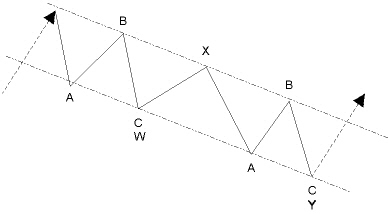
Drawing a price trend channel, it is a good idea to distinguish a double zigzag from an impulse wave .
Both have about the same characteristics.
However, double zigzags fit almost perfect within the price channel. On the other hand, if it is a wave 3, remember that a wave 3 mostly will break this channel, being the bigger, more accelerating move.
Both have about the same characteristics.
However, double zigzags fit almost perfect within the price channel. On the other hand, if it is a wave 3, remember that a wave 3 mostly will break this channel, being the bigger, more accelerating move.
Price target for a double zigzag.
Courtesy :http://stocata.org/ta_en/elliott7.html
No comments:
Post a Comment